Making choices#
Previously, we learned how to visualize traffic data, and used plots to distinguish between weekdays and weekends. How can we use Python to automatically recognize different features we saw, and take a different action for each? In this lesson, we’ll learn how to write code that runs only when certain conditions are true, and use this to make a clearer plot of our traffic data.
Conditionals#
We can ask Python to take different actions, depending on a condition, with an if statement:
num = 50
if num > 100:
    print('greater')
else:
    print('lesser')
print('done')
lesser
done
The second line of this code uses the keyword if to tell Python that we want to make a choice. If the test that follows the if statement is true, the body of the if (i.e., the set of lines indented underneath it) is executed, and “greater” is printed. If the test is false, the body of the else is executed instead, and “lesser” is printed. Only one or the other is ever executed before continuing on with program execution to print “done”:

Conditional statements don’t have to include an else. If there isn’t one, Python simply does nothing if the test is false:
num = 50
print('before conditional...')
if num > 100:
    print(num, 'is greater than 100')
print('...after conditional')
before conditional...
...after conditional
We can also chain several tests together using elif, which is short for “else if”. The following Python code uses elif to categorize traffic levels:
traffic_count = 3500

if traffic_count > 5000:
    print(traffic_count, 'is very heavy traffic')
elif traffic_count > 3000:
    print(traffic_count, 'is heavy traffic')
else:
    print(traffic_count, 'is normal traffic')
3500 is heavy traffic
Comparing in Python
Along with the > and == operators we have already used for comparing values in our conditionals, there are a few more options to know about:
>: greater than<: less than==: equal to!=: does not equal>=: greater than or equal to<=: less than or equal to
Note that to test for equality we use a double equals sign == rather than a single equals sign = which is used to assign values.
We can also combine tests using and and or. and is only true if both parts are true:
if 50 > 30 and 20 >= 15:
    print('both parts are true')
else:
    print('at least one part is false')
both parts are true
while or is true if at least one part is true:
if 20 > 50 or 20 >= 15:
    print('at least one test is true')
at least one test is true
Under the hood, all of these comparison tests actually return a boolean value (True or False). We can see this by executing them outside of the if statement:
print(50 > 30)
print(15 >= 20)
True
False
Conditionals (if, elif, else) work by testing whether their condition evaluates to True or False.
We can just use these boolean values directly in our conditionals:
if True:
    print('This will print')
This will print
if False:
    print('This will not print')
This doesn’t seem very useful at first, but it can come in handy (e.g. for testing and debugging).
We can also use the not operator to invert a boolean value (turn True into False and vice versa):
if not 10 > 20:
    print('10 is not greater than 20')
10 is not greater than 20
Using conditionals to make a clearer plot#
Now let’s try to use this to make a clearer plot of our traffic data. We’re going to use conditionals to show weekends and weekdays in different colors.
First, let’s make sure the data is loaded and the libraries we need are imported:
import numpy
import matplotlib.pyplot as plt
traffic_data = numpy.loadtxt('traffic_data.txt', delimiter=',')
Now, we need a way for Python to determine whether a day is a weekday or a weekend using an if statement. We know that weekdays have much higher traffic around rush hour, so let’s try looking at the 7am - 8am traffic reading for each day:
traffic_data = numpy.loadtxt('traffic_data.txt', delimiter=',')

for day in traffic_data:
    print(day[7])
953.0
2220.0
6990.0
6676.0
7055.0
6441.0
6083.0
2191.0
2057.0
Ah, from this we can see that (the middle five days), there’s always more than 5000 cars passing from 7 to 8am, and on weekends (the first and last two days) always less. Let’s try using that as our conditional.
To make the plot clearer, we can use the color parameter in plt.plot() to specify what color each line should be. We’ll use a loop with an if statement to check each day’s 7am traffic and plot it in a different color depending on whether it’s a weekday or weekend:
for i in range(len(traffic_data)):
    if traffic_data[i, 7] > 5000: # weekday if true
        plt.plot(traffic_data[i], color='blue')
    else:
        plt.plot(traffic_data[i], color='orange')
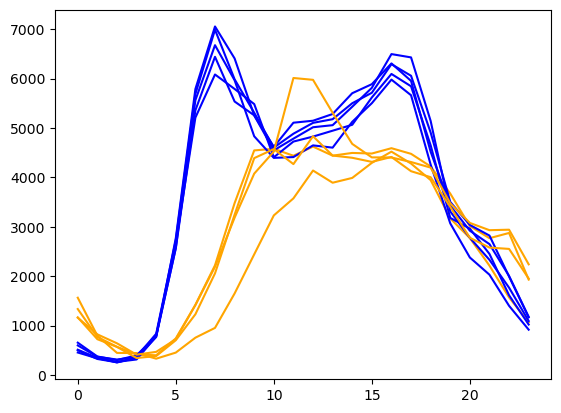
Now the plot is more clear, and we can easily see the difference between weekday and weekend traffic patterns! This even gets us some additional insights—for example, it’s easy to see that the weekends have less traffic overall than the weekdays, in addition to the peak time difference.
Challenge: How Many Paths?
Consider this code:
traffic_count = 4500

if traffic_count > 5000:
    print('A')
elif traffic_count == 5000:
    print('B')
elif traffic_count < 5000:
    print('C')
Which of the following would be printed if you were to run this code? Why did you pick this answer?
A
B
C
B and C
Solution
C gets printed because the first two conditions, traffic_count > 5000 and traffic_count == 5000, are not true, but traffic_count < 5000 is true. In this case only one of these conditions can be true at a time, but in other scenarios multiple elif conditions could be met. In these scenarios only the action associated with the first true elif condition will occur, starting from the top of the conditional section.
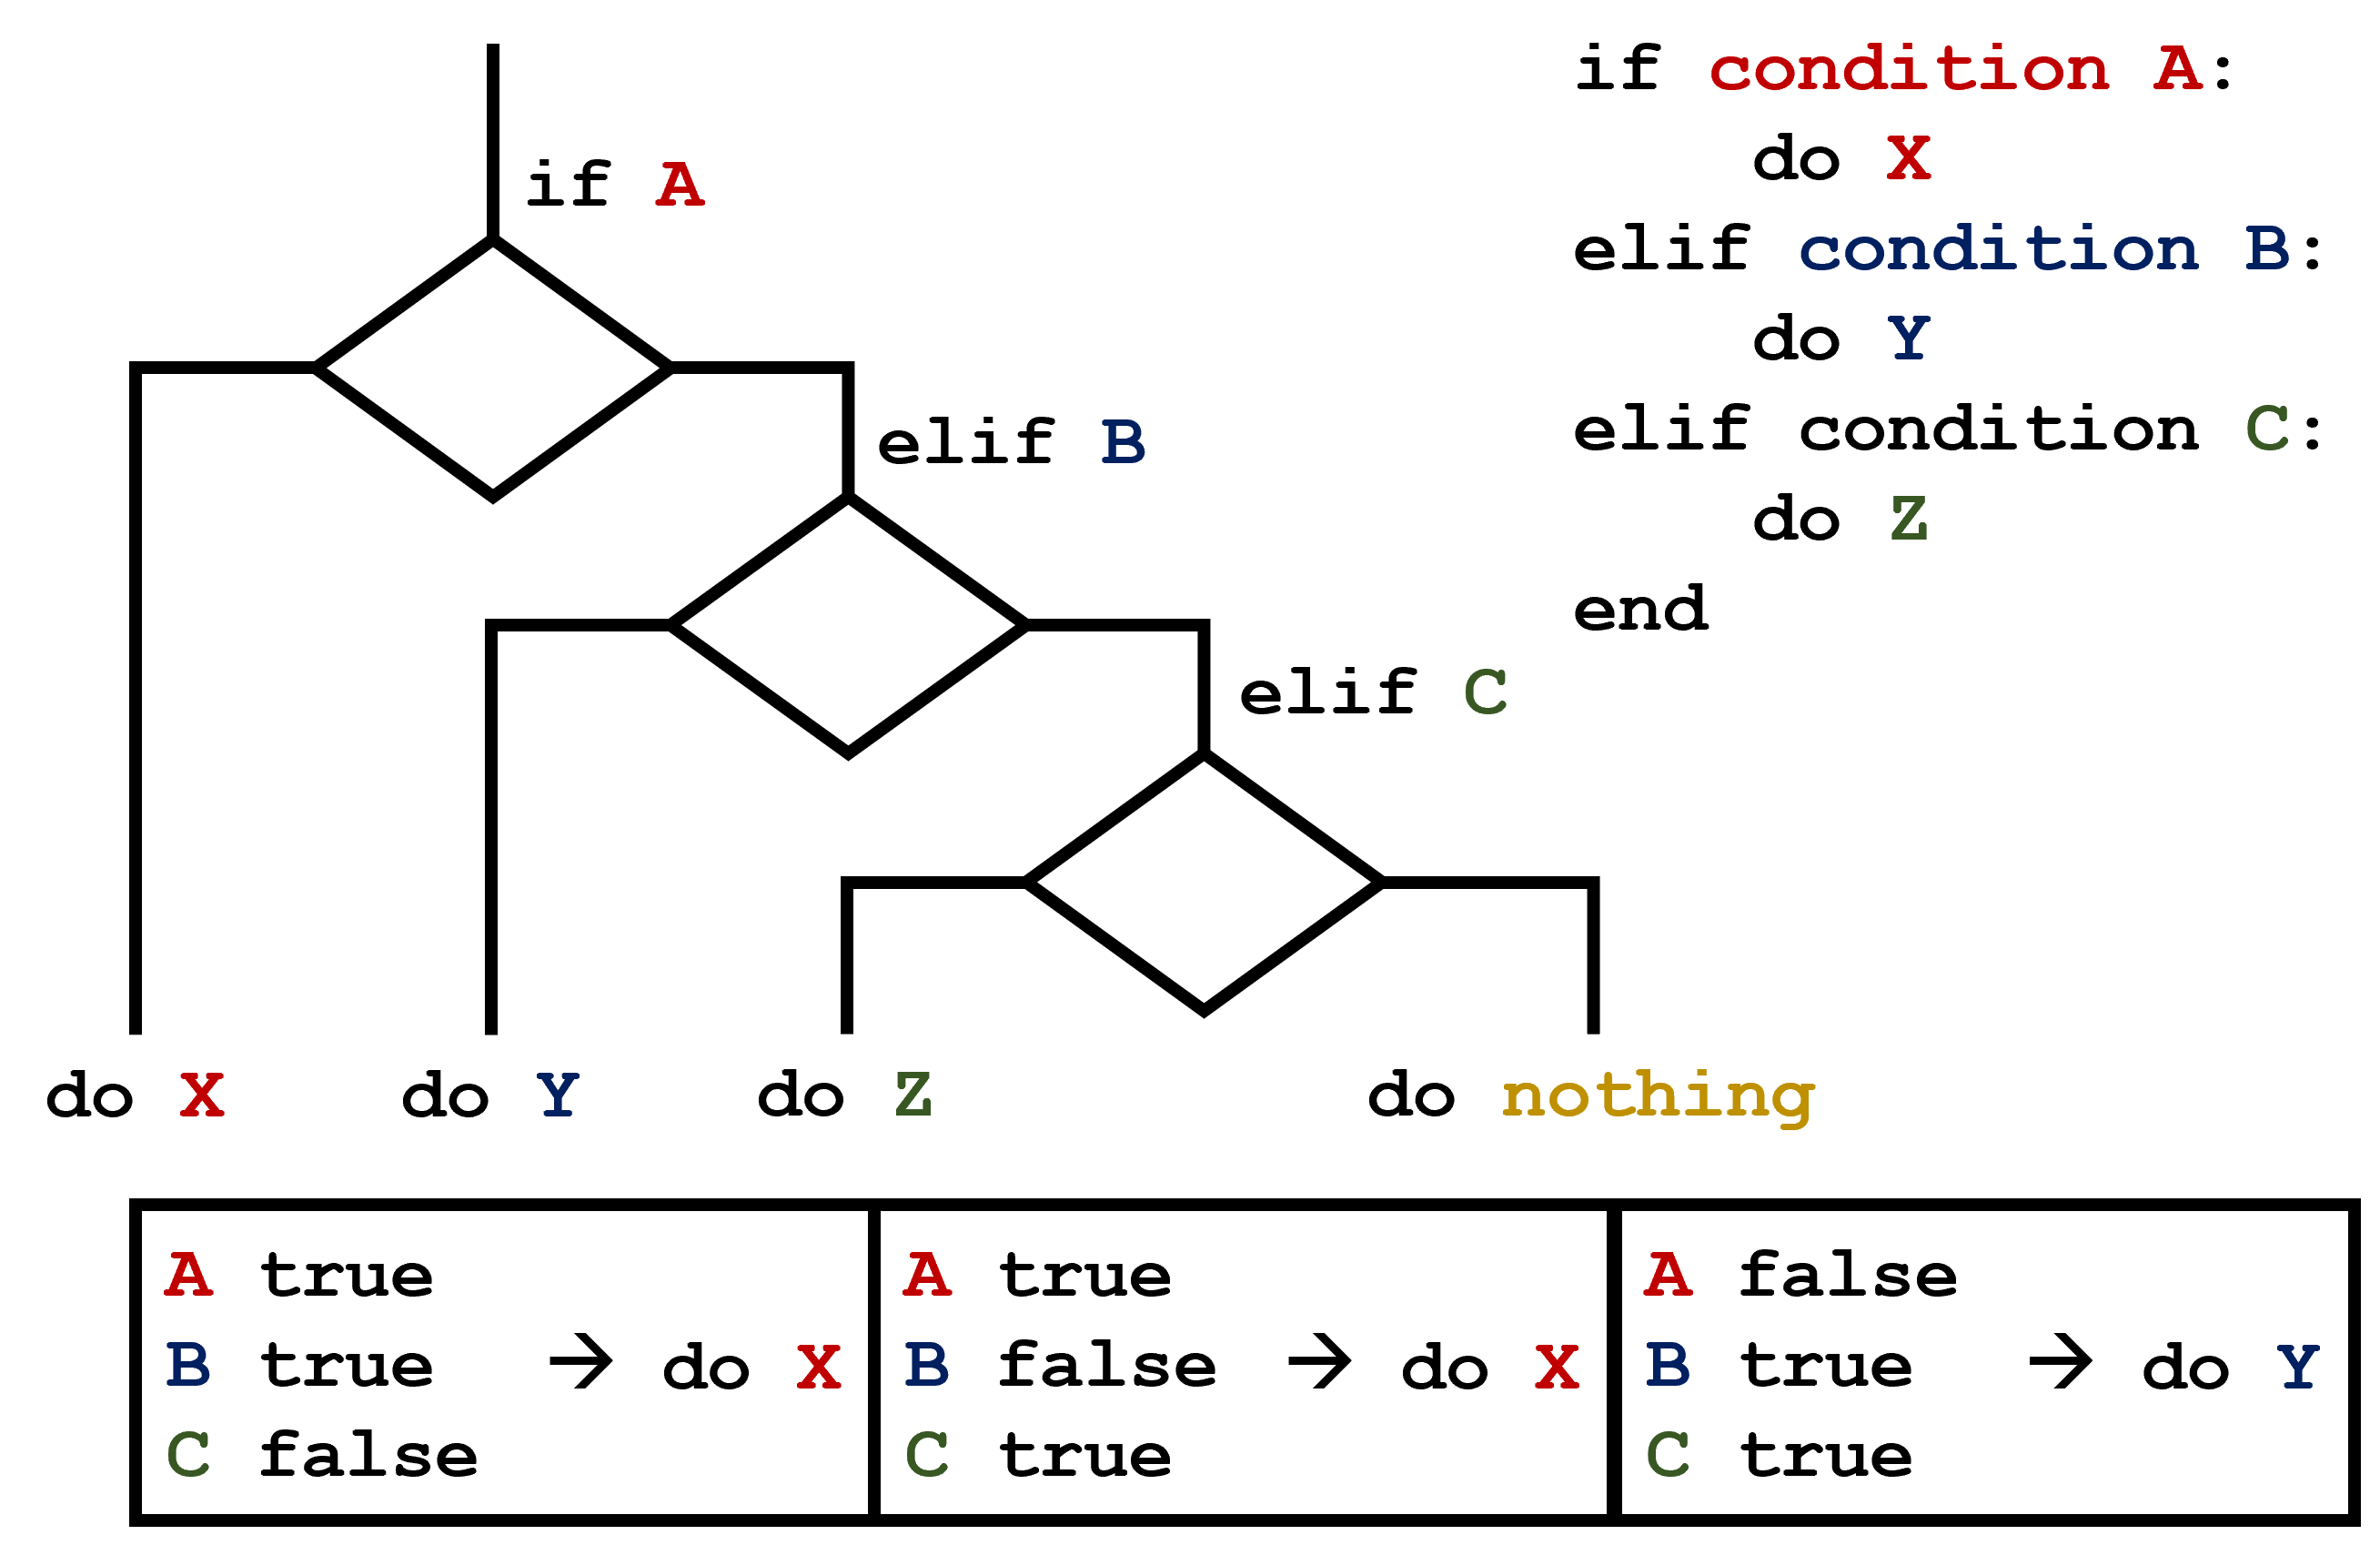
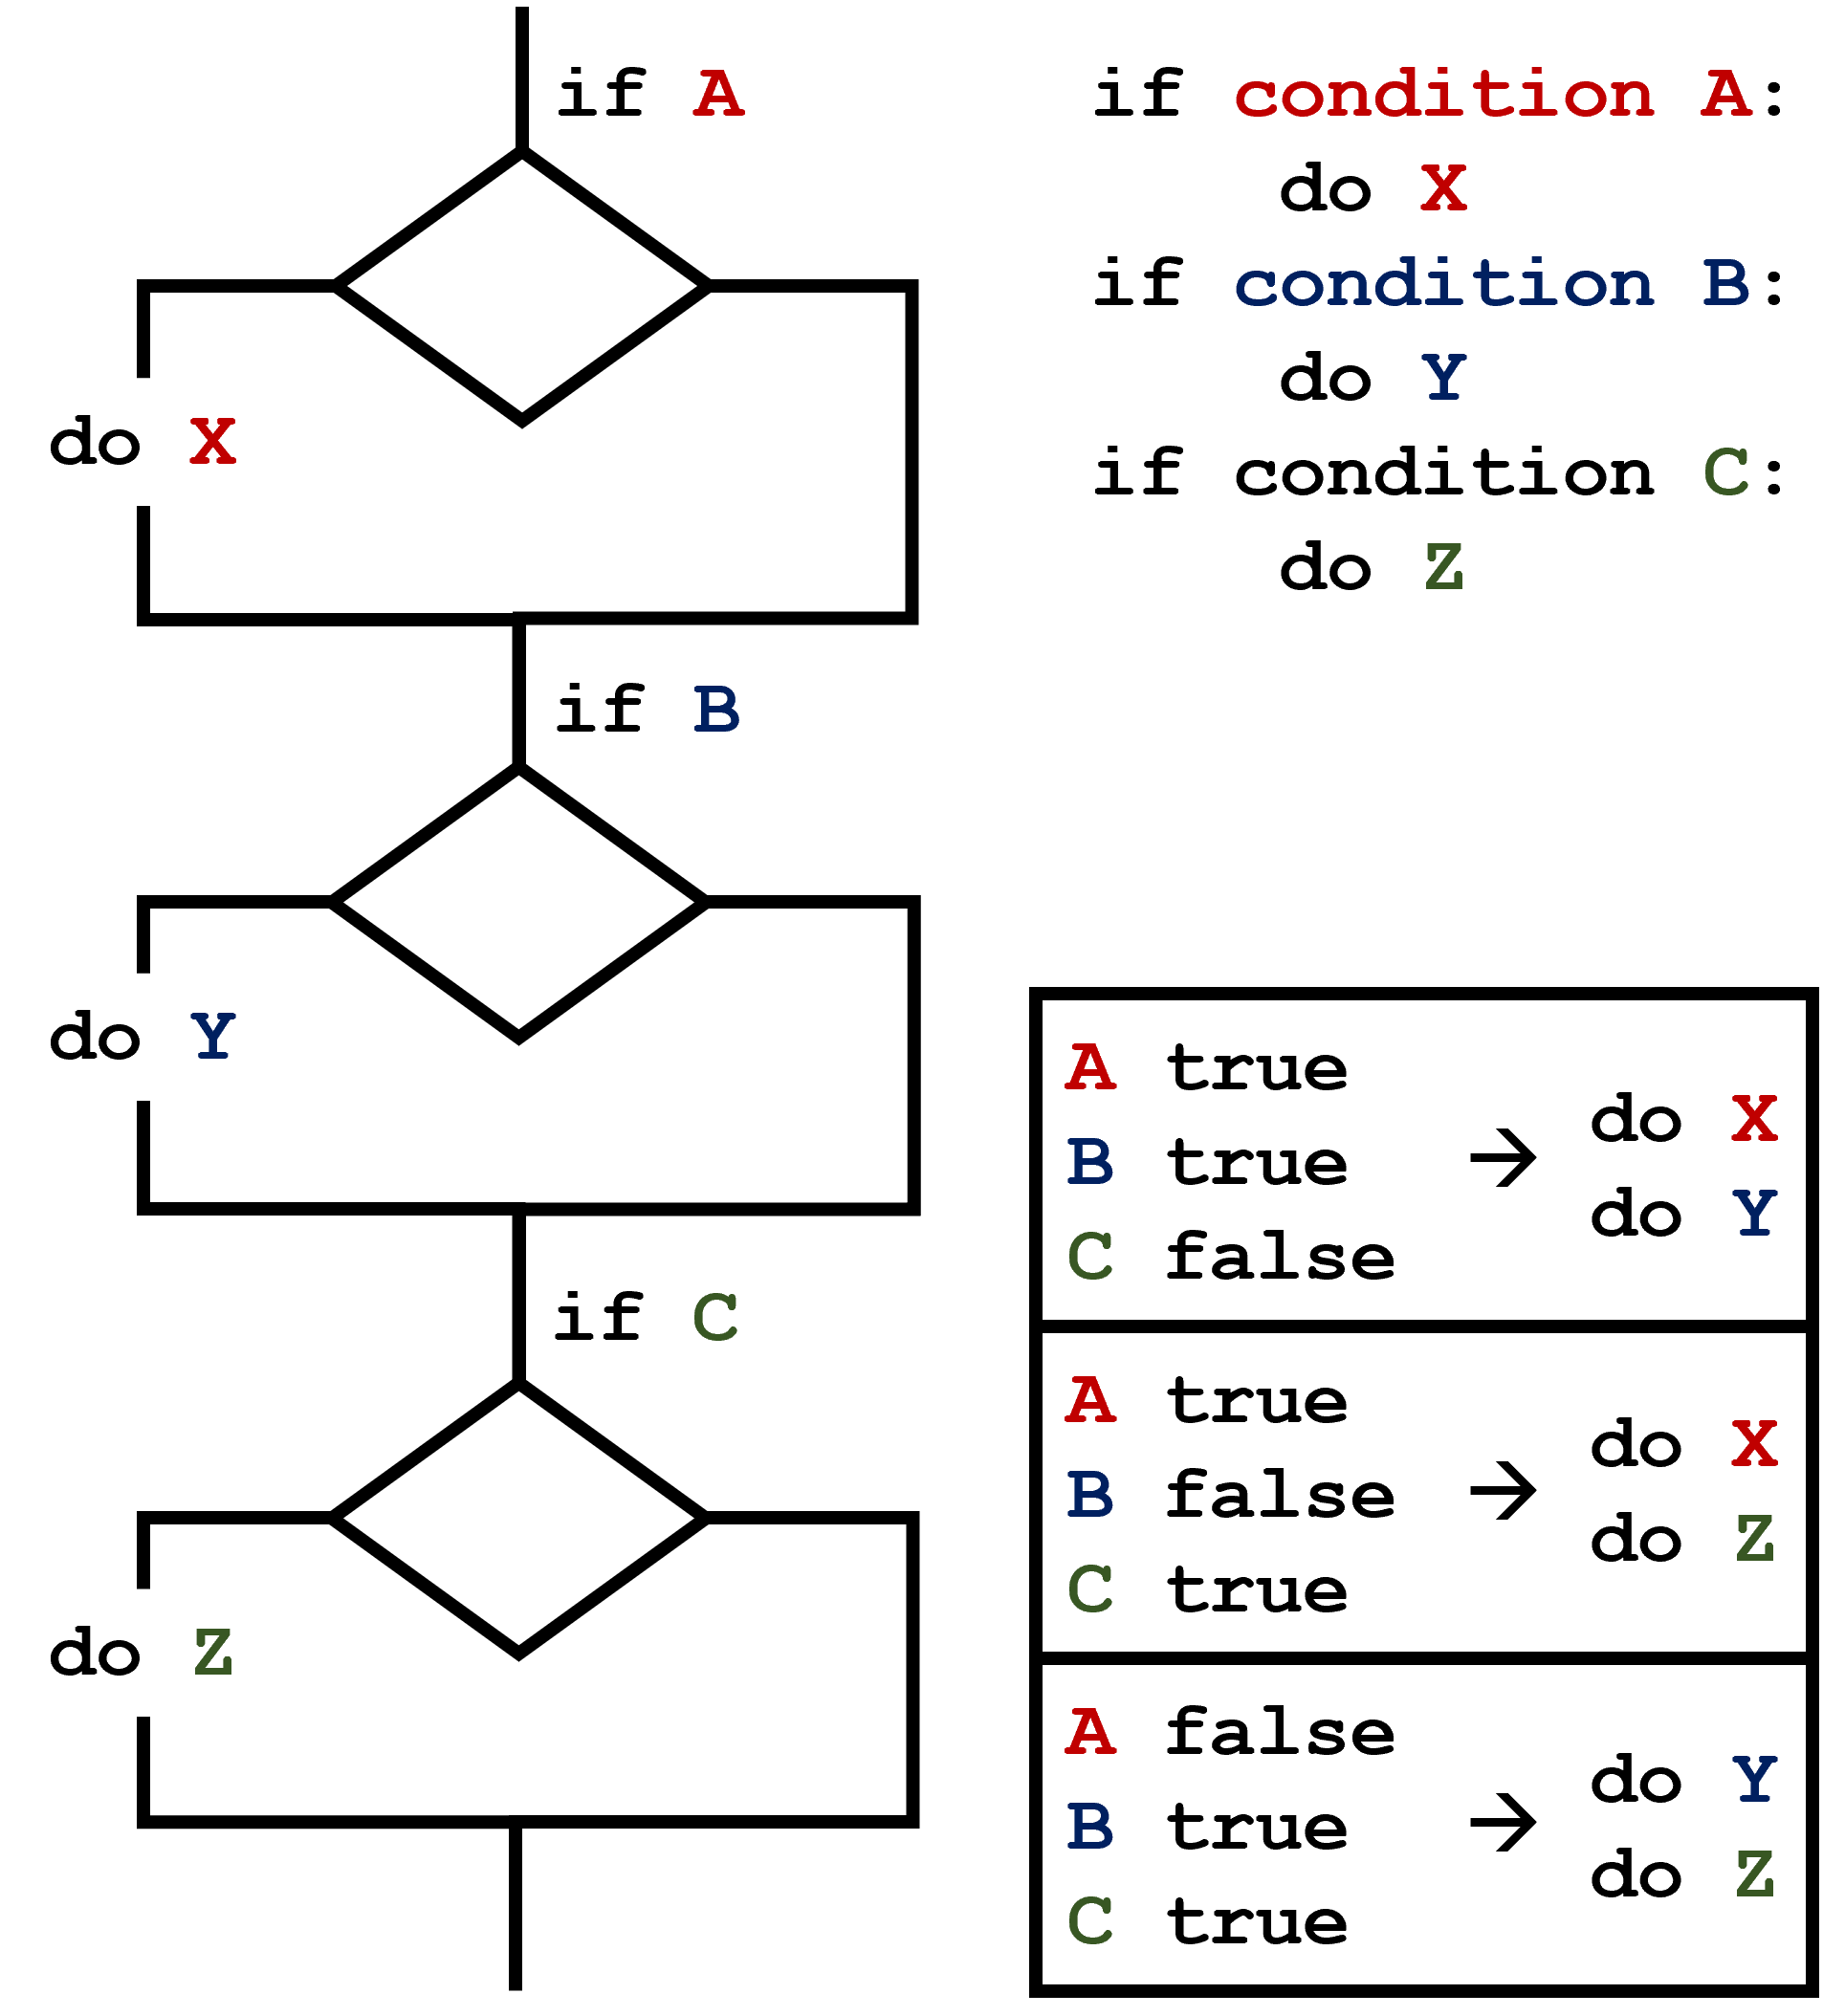
This contrasts with the case of multiple if statements, where every action can occur as long as their condition is met.
Challenge: What Is Truth?
True and False booleans are not the only values in Python that are true and false. In fact, any value can be used in an if or elif. After reading and running the code below, explain what the rule is for which values are considered true and which are considered false.
if '':
    print('empty string is True')
if 'hello':
    print('strings are True')
if []:
    print('empty list is True')
if [100, 200, 300]:
    print('non-empty list is True')
if 0:
    print('zero is True')
if 1:
    print('one is True')
Solution
The rule is that non-zero numbers and collections (lists, strings, etc.) with at least one element are considered True, but zero and empty collections are considered False.
This property of being considered True in a conditional is colloquially called truthiness.
Challenge: Counting Heavy Traffic Hours
Write a loop that counts the number of hours in a day where traffic exceeds 5000 vehicles and test it on a few different days from the traffic dataset.
Hint: Your code should look something like this:
day = traffic_data[0] # change the index to test a different day
heavy_count = 0

for hour in day:
    # Implement the condition to check if the traffic is heavy
Solution
day = traffic_data[0] # change the index to test a different day
heavy_count = 0

for hour in day:
    if hour > 5000:
        heavy_count += 1
print('Number of hours with heavy traffic:', heavy_count)
It’s easy enough to manually change the index to test a different day because we only have a few days in the dataset. But what if we had thousands of days? What we want is for the code to automatically test all the days in the dataset for us.
Extend your code to do this by using a loop to run it on each day in the dataset. Which day or days had the most heavy traffic hours?
Hint: You will need to use two nested loops. The outer loop should iterate over the days in the dataset, and the inner loop should iterate over the hours in each day.
Solution
for day in traffic_data:
    heavy_count = 0
    for hour in day:
        if hour > 5000:
            heavy_count += 1
    print('Number of hours with heavy traffic:', heavy_count)
Number of hours with heavy traffic: 0
Number of hours with heavy traffic: 0
Number of hours with heavy traffic: 10
Number of hours with heavy traffic: 7
Number of hours with heavy traffic: 11
Number of hours with heavy traffic: 11
Number of hours with heavy traffic: 8
Number of hours with heavy traffic: 3
Number of hours with heavy traffic: 0
We can see that the fifth and sixth days (Weds and Thurs) had the most heavy traffic hours, with 11 hours each.